


Looking to invest in a long term equity fund? FundsIndia has a suggestion for you.
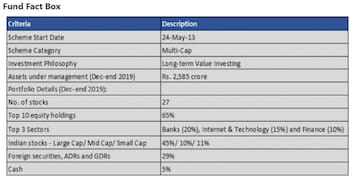
Parag Parikh Long Term Equity Fund adheres to the value style
of investing and selects stocks across market cap (large, mid and small-sized companies). It follows the buy-and-hold strategy and manages a concentrated portfolio of a few high-conviction stocks.
Global exposure: The fund’s exposure to global stocks provides investors with a hedge against country-specific risk.
Minimises downside risk: The fund has been successful at reducing downsides. That is, it has performed better than its benchmark, Nifty 500 TRI in periods when the markets fell. The fund takes cash calls when pricey valuations make it difficult to find suitable investment opportunities.
Consistent performance: The fund has generated average rolling returns of around 15 percent over the 3-year and 5-year periods. It has outperformed the Nifty 500 TRI on average by 1.3 – 2 percentage points.
Searching for value in India and globally
The fund invests in value stocks (those trading below their intrinsic value) from across Indian and global companies. It chooses stocks across market cap depending on where valuations are attractive.
Global exposure diversifies risk
The fund’s exposure to foreign securities helps diversify country-specific risk. It also gives investors the opportunity to invest in companies (such as Facebook, for instance) that may not have Indian counterparts. It can invest up to 35 percent of its corpus in foreign equity securities.
Buy and hold philosophy
The fund follows a longer-term approach via the ‘buy and hold’ strategy. Nearly 41 percent of the fund’s December 2019 corpus was in stocks that it had held for at least 4 years. This approach is also reflected in the low portfolio turnover ratio of 5.3 percent (excluding equity arbitrage) in December 2019.
Concentrated portfolio
The fund holds a concentrated high-conviction portfolio of a few stocks that are not churned frequently. The top 10 holdings accounted for 65 percent of its corpus in December 2019.
Minimises downside risk in the bad years – falls less than the benchmark
Downside capture ratio far below 100 percent
The fund has managed downsides well as indicated by its Downside Capture Ratio (DCR) of 35 percent for the period May 2013 (inception) to December 2019. The fund buys stocks only at reasonable valuations and is therefore able to limit the downside (from thereon) effectively. This is true for other well-managed value funds too.
The DCR provides a snapshot view of a fund’s ability at containing downsides. A value less than 100 percent indicates that the fund returns have fallen less than the benchmark index returns (or the fund has captured less of the downside) in periods when the markets fell. Lower the ratio, the better it is.
Shows lower drawdowns over time
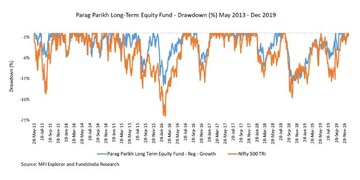
Alternatively, one can also look at the Maximum Drawdown Chart to see how a fund has performed in the down-market years.
The chart plots the daily fund (Nifty) returns. That is, the change in the fund NAV (Nifty Index) each day relative to the highest fund NAV (Nifty Index) up till that day, over a period of time.
Simply put, it shows the extent of fall in the fund NAV (Nifty Index) each day compared to the previous peak until then.
As you can see, fund returns have fallen less than the Nifty 500 TRI returns.
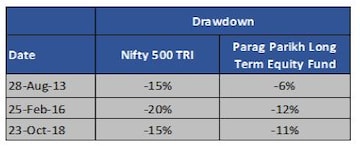
The table below picks out a few cases of sharp drawdowns for the Nifty 500 TRI from the chart. As you can see, the fall in fund returns is not as steep as that in the Nifty 500 TRI returns.
Displays lower intra-year volatility
The picture becomes clearer still when we look at the Intra-Year Drawdowns. Here we isolate the sharpest drawdowns for each year for the fund and the Nifty TRI.
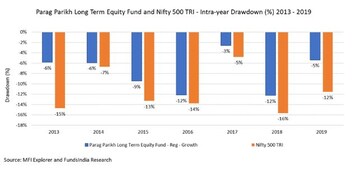
Let’s take 2015 for instance. While the steepest drawdown (from the peak to the trough for the year) in the fund returns was minus 9 percent, that for the Nifty 500 TRI was minus 13 percent. Please note though, the steepest drawdowns are starkly different from the yearly returns for 2015.
The fund and the Nifty 500 TRI returns for 2015 (from January 1 to December 30) were 8.7 percent and 0.04 percent respectively. That is, both the fund and the broader markets closed the year positively. What the drawdowns reflect is intra-year volatility – the sharpest falls in the fund and the index returns – during the year – and not between the first and the last day of the year.
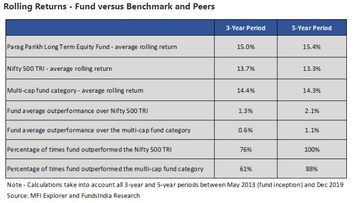
Consistent performer
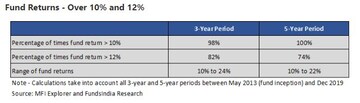
Parag Parikh Long Term Equity Fund has outperformed the Nifty 500 TRI and also its peer funds over the 3-year and 5-year periods on a rolling-return basis. For instance, over a 5-year period, the fund has beaten the benchmark 100 percent of the times with the average outperformance being 2.1 percent points.
On an absolute rolling return basis too, the fund has fared well. For example, the fund has given returns exceeding 10 percent over a 5-year period, 100 percent of the time. See the tables below for more details.
Experienced fund managers
Parag Parikh Long Term Equity Fund is managed by Rajeev Thakkar (CIO and Equity Fund Manager) and Raunak Onkar (Fund Manager for Overseas Securities).
Rajeev Thakkar has 18 years of experience in fund management. He has been with Parag Parikh Financial Advisory Services since 2001. Raunak Onkar has been in charge of the overseas securities since the fund’s inception.
Scores high on investor communication
The fund conducts annual conference calls for investors. Conference call recordings and fund manager interviews are available on the fund website. Apart from that, the fund fact sheet includes a ‘Note from CIO’ which sometimes provides brief explanations for certain investment decisions.
Fund eats its own cooking
The fund promoters and members of the fund management team too invest in the scheme. This ensures accountability in some form. As of Nov-end 2019, 5.22% of the fund’s corpus was held by insiders including the PPFAS Sponsor Company, promoters and key employees.
But expect underperformance in momentum-driven bull markets
The fund can be an underperformer in momentum-based rallies. It believes in value buying (buying stocks that are trading at a discount to their intrinsic value) and may, therefore, keep away from high-growth stocks if valuations are pricey. The fund’s Upside Capture Ratio of 73 percent (May 2013 to December 2019) which is less than 100 percent indicates underperformance in the years when the markets were up.
The fund takes cash calls – holds cash instead of deploying the corpus when markets are overvalued and appropriate investment opportunities are hard to come by. This may, however, turn out to be a missed opportunity if the markets rally while the fund is holding on to cash.
Suits investors
Maulik Madhu is a Senior Research Analyst at FundsIndia.
First Published: Jan 27, 2020 6:00 AM IST
Check out our in-depth Market Coverage, Business News & get real-time Stock Market Updates on CNBC-TV18. Also, Watch our channels CNBC-TV18, CNBC Awaaz and CNBC Bajar Live on-the-go!

Lok Sabha Election Phase 2: Experts decode the key trends and issues in key battleground states
Apr 26, 2024 11:53 PM
2024 Lok Sabha Election | Which way the wind blows in the second phase
Apr 26, 2024 6:09 PM