


Last week, Moody’s put the spotlight on China’s ageing population, saying: “The declining labour contribution to growth will be a key drag on China’s economic potential should policy measures fail to boost the birthrate and promote productivity.” The global rating agency went on to point out that an ageing population will impact demand for homes and reduce the labour pool available, leading to higher wages and an impact on China’s competitiveness. Moody’s notes in a separate piece that: “Demographics will support housing demand in Indonesia and Vietnam over the next decade”, this even as China experiences quite the opposite.
Is this another cause for concern for China, given that demographics are only one factor that drives economic trends? Yes. We’ll tell you why. But this isn’t China’s only problem at the moment. As El Erian, the Chief Economic Advisor to Allianz puts it, “China faces the risk of two major economic/financial problems coming together … and having them fuel and be amplified by financial instability: First, insufficient domestic growth drivers in the face of external headwinds; and second, long-standing pockets of excessive debt and leverage turning into system-wide detractors of growth, confidence, and capital availability. The authorities’ policy responses are yet to deal with either in a determined fashion”.
DEMOGRAPHICS MATTER FOR CHINA
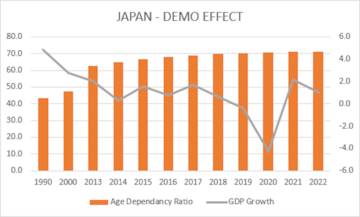
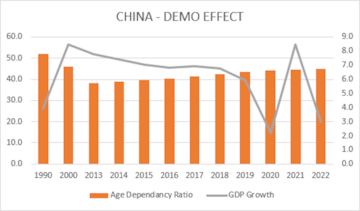
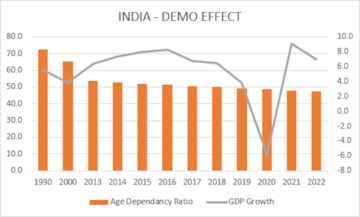
While demographics haven’t historically been the only factor driving or pulling back growth across the world, their impact also varies from economy to economy. We looked at the correlation of the trend in growth and demographics for key countries and found that the correlation for US and India was very weak, moderate for Japan, but clearly of some significance for China, with a reading of 0.57 for the past 10 years.
What’s important to note here is that the age dependency ratio after dropping sharply for China in the early part of this century has started trending up, while it is moving down for India. What’s more important to factor is that this is due to a sharp increase in the dependency of the older age population and not those of young dependants. This suggests more need for healthcare services and more pension payouts as the years go by. Harvard professor economics and demography David E Bloom pointed out in a piece on the subject: “Three decades ago, the world was populated by more than three times as many adolescents and young adults (15- to 24-year-olds) as older people. Three decades from now, those age groups will be roughly on par.” And the skew could be worse for ageing economies.
Age dependency ratio (% of working age population)
| Country | 1990 | 2000 | 2013 | 2014 | 2015 | 2016 | 2017 | 2018 | 2019 | 2020 | 2021 | 2022 | ||||||
| Australia | 49.5 | 49.5 | 50.0 | 50.5 | 51.1 | 51.7 | 52.1 | 52.6 | 52.9 | 53.3 | 53.7 | 54.0 | ||||||
| Brazil | 65.9 | 54.6 | 44.5 | 44.0 | 43.7 | 43.4 | 43.2 | 43.2 | 43.1 | 43.1 | 43.1 | 43.2 | ||||||
| China | 51.9 | 45.9 | 38.2 | 38.9 | 39.6 | 40.5 | 41.5 | 42.6 | 43.4 | 44.1 | 44.5 | 44.9 | ||||||
| France | 51.9 | 53.5 | 57.4 | 58.5 | 59.5 | 60.3 | 61.0 | 61.7 | 62.3 | 62.8 | 63.1 | 63.6 | ||||||
| Germany | 45.0 | 47.1 | 51.1 | 51.4 | 51.9 | 52.5 | 53.1 | 53.9 | 54.7 | 55.6 | 56.4 | 57.2 | ||||||
| India | 72.6 | 65.4 | 53.7 | 52.9 | 52.1 | 51.4 | 50.7 | 50.0 | 49.4 | 48.8 | 48.1 | 47.5 | ||||||
| Indonesia | 66.1 | 55.3 | 50.1 | 49.7 | 49.4 | 49.1 | 48.8 | 48.5 | 48.3 | 48.0 | 47.6 | 47.2 | ||||||
| Japan | 43.4 | 47.4 | 62.6 | 64.8 | 66.7 | 68.0 | 69.1 | 69.9 | 70.5 | 70.9 | 71.1 | 71.1 | ||||||
| Mexico | 75.9 | 64.6 | 54.3 | 53.6 | 52.9 | 52.3 | 51.7 | 51.2 | 50.6 | 50.1 | 49.4 | 48.9 | ||||||
| United Kingdom | 53.2 | 53.3 | 53.7 | 54.4 | 55.1 | 55.7 | 56.3 | 56.8 | 57.2 | 57.5 | 57.7 | 57.8 | ||||||
| United States | 51.2 | 50.9 | 50.2 | 50.5 | 50.7 | 51.2 | 51.8 | 52.2 | 52.7 | 53.2 | 53.7 | 54.1 | ||||||
| Vietnam | 78.4 | 60.2 | 43.3 | 43.5 | 43.8 | 44.0 | 44.2 | 44.5 | 44.8 | 45.2 | 45.6 | 46.0 | ||||||
Age dependency ratio, old (% of working age population)
| Country | 1990 | 2000 | 2013 | 2014 | 2015 | 2016 | 2017 | 2018 | 2019 | 2020 | 2021 | 2022 | |||||
| Australia | 16.6 | 18.5 | 21.6 | 22.1 | 22.6 | 23.0 | 23.5 | 23.9 | 24.4 | 24.9 | 25.5 | 26.0 | |||||
| Brazil | 7.4 | 8.5 | 10.7 | 11.0 | 11.4 | 11.7 | 12.1 | 12.5 | 12.9 | 13.3 | 13.7 | 14.1 | |||||
| China | 8.0 | 10.1 | 12.9 | 13.4 | 14.0 | 14.7 | 15.5 | 16.4 | 17.2 | 18.2 | 19.0 | 19.9 | |||||
| France | 21.4 | 24.8 | 28.6 | 29.6 | 30.5 | 31.3 | 32.1 | 32.8 | 33.6 | 34.2 | 34.8 | 35.4 | |||||
| Germany | 21.6 | 24.2 | 31.1 | 31.4 | 31.8 | 32.2 | 32.6 | 33.1 | 33.6 | 34.2 | 34.7 | 35.2 | |||||
| India | 7.0 | 7.4 | 8.2 | 8.3 | 8.6 | 8.8 | 9.1 | 9.4 | 9.7 | 9.9 | 10.1 | 10.2 | |||||
| Indonesia | 6.7 | 7.8 | 9.1 | 9.2 | 9.2 | 9.3 | 9.4 | 9.6 | 9.8 | 9.9 | 10.0 | 10.1 | |||||
| Japan | 17.8 | 26.3 | 41.6 | 43.7 | 45.5 | 47.0 | 48.1 | 49.1 | 49.9 | 50.6 | 51.0 | 51.2 | |||||
| Mexico | 7.2 | 8.2 | 10.2 | 10.4 | 10.7 | 11.0 | 11.3 | 11.6 | 11.9 | 12.0 | 12.2 | 12.4 | |||||
| United Kingdom | 24.1 | 24.1 | 26.6 | 27.2 | 27.6 | 28.0 | 28.4 | 28.7 | 29.1 | 29.5 | 29.8 | 30.3 | |||||
| United States | 18.6 | 18.6 | 20.9 | 21.3 | 21.6 | 22.2 | 22.9 | 23.4 | 24.1 | 24.9 | 25.6 | 26.4 | |||||
| Vietnam | 10.0 | 9.9 | 9.5 | 9.7 | 10.1 | 10.4 | 10.8 | 11.2 | 11.7 | 12.2 | 12.7 | 13.3 | |||||
(Source: World Bank data)
INDIA WILL NEED MORE THAN YOUTH
India hasn’t shown any significant change in its growth trajectory due to demographic factors historically. But some of that can change with a concerted effort to maximise productivity of a growing working class by creating the right kind of opportunities.
As Bloom says: “It is an overstatement to say that demography determines all, as it downplays the fact that both demographic trajectories and their development implications are responsive to economic incentives; to policy and institutional reforms; and to changes in technology, cultural norms, and behavior.” He adds: “Technological innovations are likely to ameliorate the effects of population aging. New drugs to slow the process of aging and add healthy years to people’s lives and the invention and deployment of assistive devices such as robots are two among many such improvements. Institutional innovations like new models of home health care, public transportation systems, the design of urban layouts, and financial instruments are also on the horizon.”
Be this as it may, demographics are not without influence. Provided they are harnessed well. With China + 1 already being a key trend, India has an opportunity to tap into China’s worsening demographic. Can India seize the moment? Or will the likes of Vietnam and Indonesia steal the thunder.
I remain hopeful.
First Published: Aug 20, 2023 4:01 PM IST
Check out our in-depth Market Coverage, Business News & get real-time Stock Market Updates on CNBC-TV18. Also, Watch our channels CNBC-TV18, CNBC Awaaz and CNBC Bajar Live on-the-go!

Lok Sabha elections 2024: Baramati to Mainpuri, key battles in phase 3
Apr 30, 2024 7:01 PM
From Amethi to Mumbai South — Lok Sabha seats where parties are yet to announce candidates
Apr 30, 2024 6:39 PM
Diamond rings, fridge, TVs: Bhopal voters to get exciting prizes to boost turnout in Lok Sabha polls
Apr 30, 2024 6:35 PM
This Bihar district has its own app to help voters during Lok Sabha election
Apr 30, 2024 4:02 PM