


Indian equity benchmarks scaled fresh four-month closing highs on Friday, as Dalal Street headed into a long weekend, amid gains in financial, metal and oil & gas shares though losses in IT shares limited the upside.
The market remained shut on Monday for the Independence Day holiday.
What do the charts suggest for Dalal Street?
The Nifty50 has formed a small positive candle on the daily chart with minor upper and lower shadows, according to Nagaraj Shetti, Technical Research Analyst at HDFC Securities.
He is of the view the index is gradually advancing towards 17,800-17,900 levels but warns that volatility might persist.
Nifty Bank headed higher
"The next resistance for the Nifty Bank lies at as the index 39,500, a move above which will lead to levels towards the 40,000 mark... Immediate support stands at 38,000," said Kunal Shah, Senior Technical Analyst at LKP Securities.
He suggests investors to take a buy-on-dips approach.
Here are key things to know about the market ahead of the August 16 session:
SGX Nifty
On Tuesday, Singapore Exchange (SGX) Nifty futures — an early indicator of the Nifty index — rose as much as 70 points or 0.4 percent to touch 17,855 ahead of the opening bell on Dalal Street.
Global markets
Equities in other Asian markets were barely in the green amid lacklustre trade, following a choppy session on Wall Street overnight. MSCI's broadest index of Asia Pacific shares outside Japan held up 0.2 percent at the last count.
Japan's Nikkei 225 and Hong Kong's Hang Seng were flat, and China's Shanghai Composite was up 0.3 percent.
S&P 500 futures edged down 0.1 percent. On Monday, the three main US indices managed to finish higher amid optimism the Fed can achieve a soft landing for the world's largest economy. The S&P 500, the Dow Jones and the Nasdaq Composite finished 0.4 percent, 0.5 percent and 0.6 percent higher respectively.
What to expect on Dalal Street
HDFC Securities' Shetti believes the short-term trend of the 50-scrip index remains positive with rangebound action.
"One may expect the continuation of choppy movement early this week... The Nifty could possibly reach around 17,800-17,900 levels.. The bulls needs to be cautious and protect their long positions with proper stop losses," he said.
Key levels to watch out for
Both the Nifty50 and the Nifty Bank are about six percent above their long-term simple moving averages in a bullish sign.
| Period (No. of sessions) | SMA | |
| Nifty50 | Nifty Bank | |
| 5 | 17,696.2 | 39,024.4 |
| 10 | 17,674.9 | 38,942.1 |
| 20 | 17,642.7 | 38,779.2 |
| 50 | 17,515.8 | 38,319.9 |
| 100 | 17,251.3 | 37,853.3 |
| 200 | 16,768.8 | 36,704.3 |
Sumeet Bagadia, Executive Director at Choice Broking, identified the following resistance and support levels:
| Index | Support | Resistance |
| Nifty50 | 17,450 | 18,000 |
| Nifty Bank | 38,000 | 40,000 |
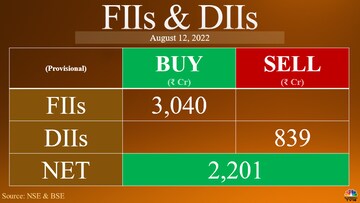
FII/DII activity
Call/put open interest
The maximum call open interest is accumulated at the strike price of 17,800, with 1.2 lakh contracts, and the next highest at 18,000, with one lakh, according to exchange data. On the other hand, the maximum put open interest is at 17,000, with almost 91,000 contracts, and 17,500, with more than 85,000 contracts.
This suggests strong resistance at 17,800 and major support at 17,500.
Long build-up
Here are five stocks that saw an increase in open interest as well as price:
| Stock | Current OI | CMP | Price change (%) | OI change (%) |
| INDIACEM | 10,628,500 | 193.5 | 0.42% | 29.06% |
| PFC | 30,070,000 | 121.2 | 1.30% | 17.75% |
| GSPL | 3,272,500 | 247.6 | 4.65% | 16.04% |
| TATACHEM | 7,432,000 | 1,122.60 | 3.91% | 14.34% |
| MUTHOOTFIN | 4,534,125 | 1,192.25 | 1.19% | 13.92% |
Long unwinding
| Stock | Current OI | CMP | Price change (%) | OI change (%) |
| BATAINDIA | 2,333,925 | 1,912.55 | -0.42% | -6.29% |
| ALKEM | 426,800 | 2,953.85 | -0.56% | -5.90% |
| ATUL | 111,900 | 9,276.15 | -1.52% | -5.43% |
| METROPOLIS | 832,800 | 1,487.20 | -0.77% | -4.90% |
| CANBK | 39,708,900 | 231.8 | -0.11% | -4.80% |
(Increase in price and decrease in open interest)
Short covering
| Stock | Current OI | CMP | Price change (%) | OI change (%) |
| EICHERMOT | 3,740,450 | 3,206.10 | 1.29% | -11.73% |
| AARTIIND | 3,375,350 | 818 | 0.17% | -8.84% |
| GRANULES | 12,692,000 | 310.35 | 1.19% | -8.23% |
| LTTS | 1,079,000 | 3,660.95 | 0.22% | -7.51% |
| GNFC | 4,577,300 | 753.7 | 0.67% | -7.44% |
(Increase in price and decrease in open interest)
Short build-up
| Stock | Current OI | CMP | Price change (%) | OI change (%) |
| IPCALAB | 813,800 | 919.95 | -9.76% | 87.94% |
| DIVISLAB | 2,442,600 | 3,726.95 | -5.75% | 26.90% |
| HDFCAMC | 2,537,400 | 1,963.75 | -3.57% | 11.09% |
| AUBANK | 6,533,000 | 634 | -1.42% | 5.95% |
| WHIRLPOOL | 452,200 | 1,797.45 | -0.56% | 5.26% |
(Decrease in price and increase in open interest)
52-week highs
A total of 18 stocks in the BSE 500 universe — the broadest index on the bourse — scaled 52-week peaks.
| ADANIENT | ICICIBANK | SCHAEFFLER |
| ADANITRANS | INDHOTEL | SIEMENS |
| APLAPOLLO | KSB | SKFINDIA |
| CUMMINSIND | METROBRAND | TATACHEM |
| DEVYANI | PAGEIND | TATAELXSI |
| FLUOROCHEM | PHOENIXLTD | TRENT |
52-week lows
No stock in the 500-scrip basket hit a 52-week low.
First Published: Aug 15, 2022 8:39 PM IST
Check out our in-depth Market Coverage, Business News & get real-time Stock Market Updates on CNBC-TV18. Also, Watch our channels CNBC-TV18, CNBC Awaaz and CNBC Bajar Live on-the-go!

Prajwal Revanna's father in custody for alleged kidnapping and sexual abuse
May 4, 2024 7:53 PM
Delhi, Indore, Surat and Banswara — why these are the most challenging domains for Congress internally
May 4, 2024 1:53 PM
Congress nominee from Puri Lok Sabha seat withdraws, citing no funds from party
May 4, 2024 12:00 PM
Lok Sabha Polls '24 | Rahul Gandhi in Rae Bareli, why not Amethi
May 4, 2024 9:43 AM