


Indian equity benchmarks made a big comeback on Friday after RBI Governor Shaktikanta Das announced a widely-expected hike of 50 basis points in the key interest rate and hinted at more increases in the coming months.
Buying across sectors pushed the headline indices higher, with financial, oil & gas, auto and metal shares being the biggest boosts.
What do the charts suggest for Dalal Street?
The Nifty50 has formed a long bull candle on the daily chart, suggesting the making of a bullish engulfing pattern, according to Nagaraj Shetti, Technical Research Analyst at HDFC Securities.
Such a move following weakness from the highs above the 18,000 mark signals the possibility of an important bottom reversal for the 50-scrip index around 16,800, he said.
More juice left in banking
Although the banking index has settled in the red for a second straight week, the weekly chart shows a hammer pattern thanks to Friday’s smart rally, Sameet Chavan, Chief Analyst-Technical and Derivatives at Angel One, told CNBCTV18.com.
"The emergence of such a pattern in an oversold market and at its 20-week exponential average (EMA) suggests one should not overlook its significance from a technical perspective," he said.
Chavan expects the relief rally in the Nifty50 to extend this week given the reversal from key support following RBI announcements.
Here are key things to know about the market ahead of the October 3 session:
SGX Nifty
On Monday, SGX Nifty futures — an early indicator of the Nifty index — fell as much as 268.5 points or 1.6 percent to 16,819.5 ahead of the opening bell on Dalal Street.
Global markets
Equities in other Asian markets saw mixed moves on Friday, as nervousness persisted among investors about the impact of steep rate hikes on economic growth. MSCI's broadest index of Asia Pacific shares outside Japan was down 0.3 percent at the last count.
Japan's Nikkei 225 was up 0.6 percent and Hong Kong's Hang Seng down 0.5 percent. The China market was shut for a holiday.
S&P 500 futures were down 0.1 percent. On Friday, the three main Wall Street gauges finished 1.5-1.7 percent lower amid rising bond yields as well as the dollar.
What to expect on Dalal Street?
HDFC Securities' Shetti believes the short-term trend of the Nifty50 has turned positive thanks to Friday's surge.
"The placement of important support and the overall chart pattern of the daily and weekly charts signal a crucial bottom reversal at 16,747," he said, adding that investors can expect follow-through upmoves this week.
"Next overhead resistance to be watched out for seems to be around 17,200-17,300 this week. A sustainable move above this hurdle is likely to open doors for 18,100 in the near term."
Key moving averages
The distance between the Nifty50 and its long-term moving average narrowed to 2.6 from about four percent. Friday's rally helped the index cross its 10-, 20- and 50-day levels.
| No. of sessions | Nifty50 | Nifty Bank |
| 5 | 17,099.4 | 38,649.1 |
| 10 | 16,973.7 | 38,239 |
| 20 | 16,938.4 | 38,065.3 |
| 50 | 17,078.4 | 38,617.3 |
| 100 | 17,420.1 | 39,887.6 |
| 200 | 17,558.4 | 39,811.4 |
Chavan expects key support for the banking index in the 37,500-37,380 zone and believes an immediate hurdle awaits at the unfilled gap of 39,230-39,420 levels. "A move beyond these levels is expected to help the Nifty Bank reclaim the 40,000 mark in the comparable period," he said.
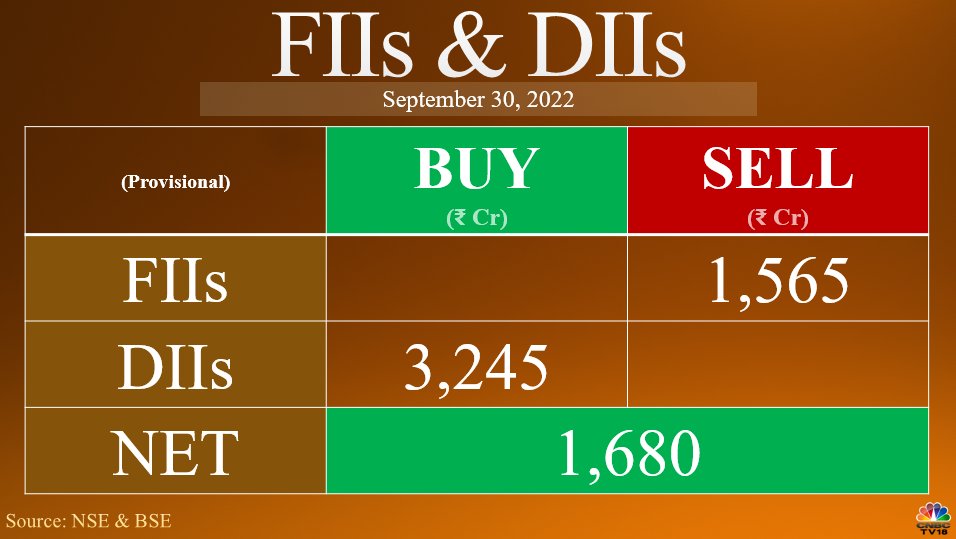
FII/DII activity
Foreign institutional investors (FIIs) remained net sellers of Indian shares for the eighth day in a row on Friday, according to provisional exchange data.
ALSO READ: 'Chakravyuh' moment in Indian market
Call/put open interest
The maximum call open interest is accumulated at the strike price of 17,500, with almost 90,000 contracts, and the next highest at 18,000, more than 78,000, according to exchange data. On the other hand, the maximum put open interest is placed at 16,700, with 97,000 contracts, and at 16,000, with about 91,000.
This indicates a tough hurdle at 17,500 and a strong base at 16,700.
Long build-up
Here are five stocks that saw an increase in open interest as well as price:
| Stock | Current OI | CMP | Price change (%) | OI change (%) |
| IDEA | 326,340,000 | 8.9 | 4.09% | 23.85% |
| INDIACEM | 12,586,000 | 274.7 | 11.30% | 16.27% |
| CUB | 4,155,000 | 174.7 | 2.07% | 12.76% |
| HEROMOTOCO | 2,463,600 | 2,557.40 | 0.25% | 10.19% |
| DEEPAKNTR | 1,800,000 | 2,016 | 1.62% | 9.99% |
Long unwinding
| Stock | Current OI | CMP | Price change (%) | OI change (%) |
| MGL | 2,788,800 | 837.9 | -4.69% | -5.77% |
| MFSL | 1,537,900 | 767.3 | -0.33% | -3.42% |
| ABBOTINDIA | 48,720 | 19,169.95 | -0.40% | -2.87% |
(Increase in price and decrease in open interest)
Short covering
| Stock | Current OI | CMP | Price change (%) | OI change (%) |
| PERSISTENT | 581,250 | 3,252 | 1.97% | -7.10% |
| INDUSTOWER | 14,756,000 | 198 | 6.28% | -4.57% |
| BAJAJFINSV | 6,883,500 | 1,690.25 | 3.34% | -4.00% |
| ATUL | 167,850 | 9,037.10 | 1.09% | -3.98% |
| LTI | 1,243,800 | 4,470.20 | 1.87% | -3.65% |
(Increase in price and decrease in open interest)
Short build-up
| Stock | Current OI | CMP | Price change (%) | OI change (%) |
| RECLTD | 33,648,000 | 94.45 | -0.37% | 13.27% |
| ICICIGI | 4,163,725 | 1,153.55 | -1.08% | 8.91% |
| ICICIPRULI | 6,328,500 | 529.55 | -0.23% | 8.34% |
| BERGEPAINT | 6,811,200 | 620.6 | -0.28% | 8.17% |
| GUJGASLTD | 6,056,250 | 485 | -3.54% | 7.99% |
(Decrease in price and increase in open interest)
Check out our in-depth Market Coverage, Business News & get real-time Stock Market Updates on CNBC-TV18. Also, Watch our channels CNBC-TV18, CNBC Awaaz and CNBC Bajar Live on-the-go!

Lok Sabha elections 2024: BJP's bid for breakthrough in Kerala is an uphill battle, say experts
Apr 23, 2024 9:53 PM
2024 Lok Sabha Elections | PM's Rajasthan speech — has it anything to do with the post-poll mood of the first phase
Apr 23, 2024 3:45 PM
It's KGF 2024 and here's a look at the key characters in Karnataka
Apr 23, 2024 3:17 PM
JP Morgan: Nifty may test 25,000 if BJP wins in 2024 Lok Sabha elections
Apr 23, 2024 2:23 PM