


You shouldn’t drive ahead with an eye on the rear view mirror, but drawing from your experience of the distance covered isn’t such a bad thing. No one knows for sure what lies ahead, that’s why projections can often go wrong. In this context historical data can be a good benchmark for future estimation. We look at historical valuations to try and assess where the market is positioned.
For this we used BSE frontline and sector indices. The findings offer interesting insights.
SOME MORE TO RUN
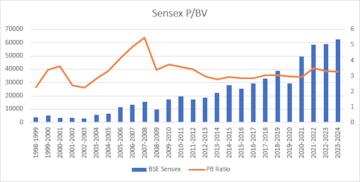
Stocks after their recent rally may still have more legs to run, if we go by historical price-to-book valuation of the BSE-Sensex. This because the average for the ongoing fiscal at 3.28x is in-line with the historical average of 3.27x for the past 26 years. And if we look at the higher averages of the more recent years, a range of 3.4-3.75x seems like an attainable band. This would translate into a 4 percent to 15 percent upside.
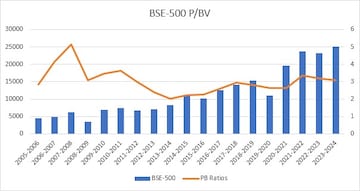
That’s for the frontline index. A broader market gauge, the BSE-500, too suggests a similar likelihood. The current BSE-500 price-to-book value ratio at 3.1x is near its average of 3x, and the previous high range suggests a possibility of an 8 percent to 17 percent upside.
So, if the market is to break out to a new high, some more gains beyond that are quite possible before stocks pull back. Given that this feat is just 1.7 percent away, a further run-up seems plausible.
VALUATION COMFORT ZONES
If the market does head higher, where does valuation comfort lie? We looked at sector indices to gauge how current valuations compared with historical trends. Here are some findings.
AUTO
The price-to-book value after the recent run-up at 4.53x is well above the historical average of 4x and sharply higher than the low of 2.6x. That said, valuations have scaled beyond 5x in a couple of years, but that might be hoping for a little much.
BANKS
Banks have been the recent favourite of most fund managers, but going purely by historical valuations, at 2.36x the lenders are trading above their historical average of 2.23x and above past lows near 1.76x. The ratio crossed 3x only in 2007-08, a year when valuations across sectors saw a peak.
CAPITAL GOODS
Capital goods stocks have traded at lofty valuations during the 2005 to 2010 period, which ranged from 5x to 12x, but since then the range has been mostly between 2.3x to 4x. The present reading of 5x is well above the average of 4.5x, but if we are entering a high valuation cycle this could be near the bottom of the range.
FMCG
Stocks in the FMCG sector have always traded at a premium to most other market segments. While on a price-to-book value basis at 8.6x they trade above the average of 8.2x, on a dividend yield basis, the 1.72 percent offered compares favourably with the average of 1.6 percent.
HEALTHCARE
The healthcare sector has some room for upside with the current price-to-book ratio at 3.8x versus the historical 4.1x. The annual average low for the sector in the past 8 years has been 2.8x and the high 5.7x. Also, in 4 of the nine years, the average was above 4x. So, there could be some steam left here.
IT SERVICES
While IT services stocks don’t look cheap from a price-to-earnings or price-to-book value perspective, with the latter at 6x compared to the average of 5.2x over the past 8 years, the dividend yield offered now at 2.2 percent is higher than in any of the past 8 years.
METALS
Metals tend to see high variations in valuation multiples, given the cyclical nature of the sector. These stocks have traded in a price-to-book range from 0.77x to 4.65x over the past 23 years, with a high valuation period followed by a long decline. At 1.58x these stocks are near their lower end, but even from here the historical lows are a good distance away.
OIL & GAS
This is one sector that’s clearly trading well below averages. While the current price-to-book value is at 1.33x, the historical average is 1.9x. The historical range is 1.27x to 4.1x. On a dividend yield basis too, the 4.3 percent is quite attractive.
REALTY
This is a peculiar one. In 2007-08, the index averaged 34x price-to-book value. If we exclude this, the historical average is 2.2x which is lower than the current 2.9x. But that’s just half the story. In the 2008-2010 period, the ratio ranged between 3.3x and 6.4x, after which the range was mostly between 0.7x to 1.8x. If we are back in a realty upcycle, comparing the ratio to earlier boom phases may be more appropriate.
INVEST IN BUSINESSES
As Warren Buffett has long espoused, investing in stocks is akin to investing in businesses. So, while the above valuation data and insights may be useful to gauge the current relative attractiveness of certain sectors, these should not be taken as a guide to where you must put your money. Once you do your homework and decide to invest in a business, such relative valuations can merely aid you in timing your purchases. Similarly, market peaks are often a good time to get out of businesses you wish to exit.
Happy investing!
Check out our in-depth Market Coverage, Business News & get real-time Stock Market Updates on CNBC-TV18. Also, Watch our channels CNBC-TV18, CNBC Awaaz and CNBC Bajar Live on-the-go!

Lok Sabha elections 2024: BJP's bid for breakthrough in Kerala is an uphill battle, say experts
Apr 23, 2024 9:53 PM
2024 Lok Sabha Elections | PM's Rajasthan speech — has it anything to do with the post-poll mood of the first phase
Apr 23, 2024 3:45 PM
It's KGF 2024 and here's a look at the key characters in Karnataka
Apr 23, 2024 3:17 PM
JP Morgan: Nifty may test 25,000 if BJP wins in 2024 Lok Sabha elections
Apr 23, 2024 2:23 PM