


“What is your UPI id?” One hears this question more and more these days. The three-year old real-time payments system UPI (Unified Payments Interface) clocked 822.29 million transactions worth Rs 1.46 lakh crore in July.
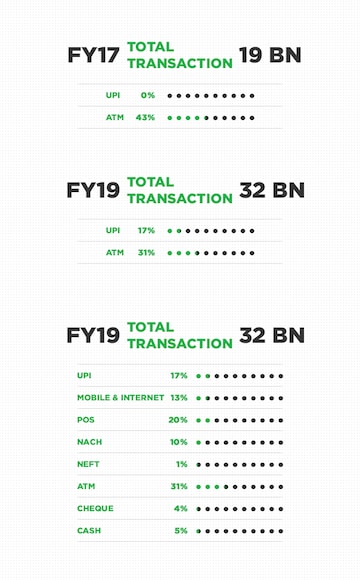
Comparatively, in FY17, out of the total 19 billion transactions that actually took place, 43 percent were via ATM. But post demonetisation, UPI share has surged to 17 percent and this has mostly been at the expense of ATM transactions.
An interesting report by Boston Consulting Group (BCG) highlights how India is poised to be world’s poster boy for disruption in banking in the coming years and how the non-bank ecosystem will become very prominent. It also says that in order to attract capital to support PM Modi’s 5 trillion dollar economy target, policy needs to proactively reinforce the non-banking ecosystem.
A closer look at the data shows that other modes of transaction like mobile and internet, point of sale, NACH, NEFT and cheque have more or less maintained their relevance as compared to FY19. Cash transactions however have fallen from 9 percent in FY17 to 5 percent in FY19.
Of the 17 percent share in UPI, Google Pay dominates with 36 percent market share. This is followed Phone Pay and Paytm.
UPI Transaction Platforms:
> 36%: Google Pay
> 29%: Phone Pay
> 25%: Paytm
> 10%: All banks, other PSPs
UPI transactions are expected to dominate the market going forward. By FY25, UPI transactions are likely to have a whopping 59 percent market share. Cash and cheque transactions are expected to take a further backseat.
 UPI payments have seen a steady rise in the last two years
First Published: Sept 9, 2019 4:51 PM IST
Check out our in-depth Market Coverage, Business News & get real-time Stock Market Updates on CNBC-TV18. Also, Watch our channels CNBC-TV18, CNBC Awaaz and CNBC Bajar Live on-the-go!

BJP MP's wife challenges him in electoral battle for Etawah seat
Apr 25, 2024 9:39 AM
Lok Sabha Election 2024: Gurugram gears up for crucial polls amidst economic boom and civic woes
Apr 24, 2024 11:41 PM